Bitcoin Analysis
Bitcoin's Price Analysis: Technical Indicators Explained
 Quest Lab Team
Bitcoin’s price volatility has long made it a topic of deep analysis and speculation within financial markets. In recent months, global economic shifts, regulatory announcements, and market liquidity have all influenced Bitcoin’s fluctuating value. Professional traders and institutional investors now increasingly rely on technical indicators to forecast Bitcoin’s future price movements. This article will delve into the technical analysis methods widely used by experts to understand Bitcoin’s price, using real-world examples from recent trends and providing insights into the most reliable indicators.
Introduction to Technical Indicators in Cryptocurrency
Technical analysis, or the study of historical price data and trading volume, is central to cryptocurrency market prediction. Unlike traditional financial assets, Bitcoin’s price is heavily influenced by speculative trading, decentralized market factors, and digital sentiment—making technical indicators a crucial tool for understanding price behavior. This article covers indicators such as Moving Averages, Relative Strength Index (RSI), Bollinger Bands, and Fibonacci Retracements, offering practical applications for each in the Bitcoin market.
The Significance of Moving Averages (MA)
Moving Averages (MAs) are among the most trusted indicators in crypto analysis. By averaging price data over a specific period, MAs smooth out short-term fluctuations, helping to reveal the underlying trend. For Bitcoin, traders commonly use the 50-day and 200-day moving averages to signal bullish or bearish trends.
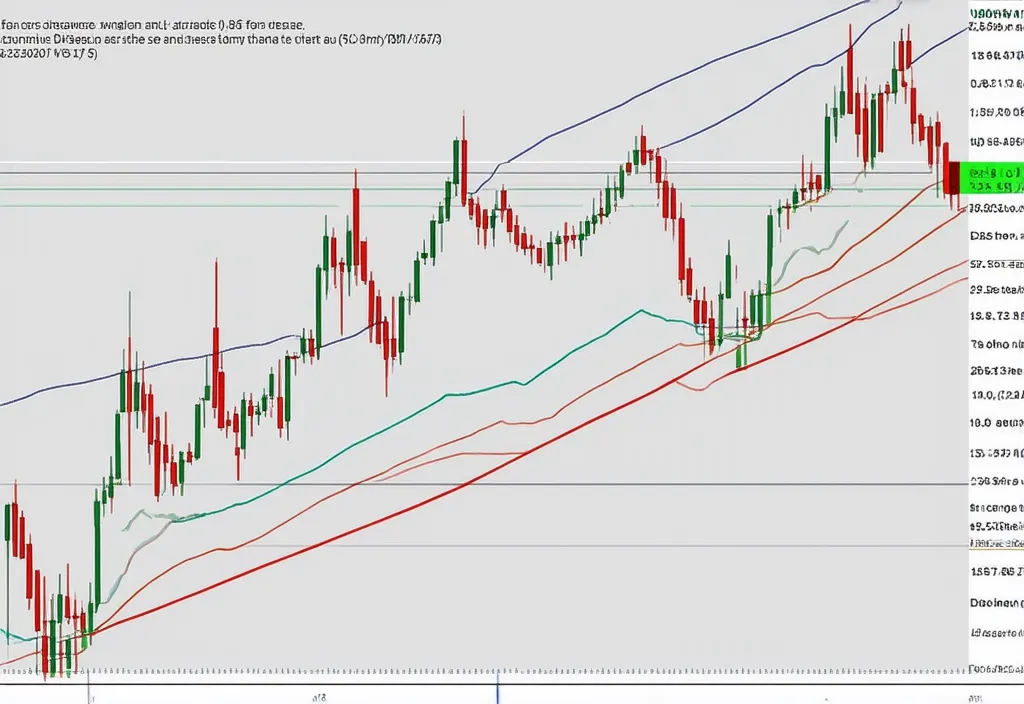
When the 50-day MA crosses above the 200-day MA (known as a ‘Golden Cross’), it signals a potential bullish trend. Conversely, when the 50-day MA crosses below the 200-day MA (a ‘Death Cross’), it may indicate a bearish trend. In early 2024, Bitcoin witnessed a Golden Cross, which correlated with a surge in its price as market sentiment turned optimistic.
"Moving Averages allow us to filter out the 'noise' in Bitcoin’s price and focus on the broader trends, especially in highly volatile markets."
Using the Relative Strength Index (RSI) to Measure Market Momentum
The Relative Strength Index (RSI) is a momentum oscillator that ranges from 0 to 100, indicating whether an asset is overbought or oversold. For Bitcoin, an RSI above 70 suggests overbought conditions (potential sell signal), while an RSI below 30 suggests oversold conditions (potential buy signal).
In August 2024, Bitcoin's RSI surged to 75 following a brief rally, indicating overbought conditions. Soon after, the price corrected by nearly 15% as traders capitalized on the high RSI levels.
Strategic Insights
RSI provides actionable insights, especially for short-term traders. Monitoring RSI levels helps to capture optimal entry and exit points based on market momentum.
- Consider selling when RSI approaches or exceeds 70.
- Look for buying opportunities when RSI dips below 30.
Exploring Bollinger Bands for Price Volatility
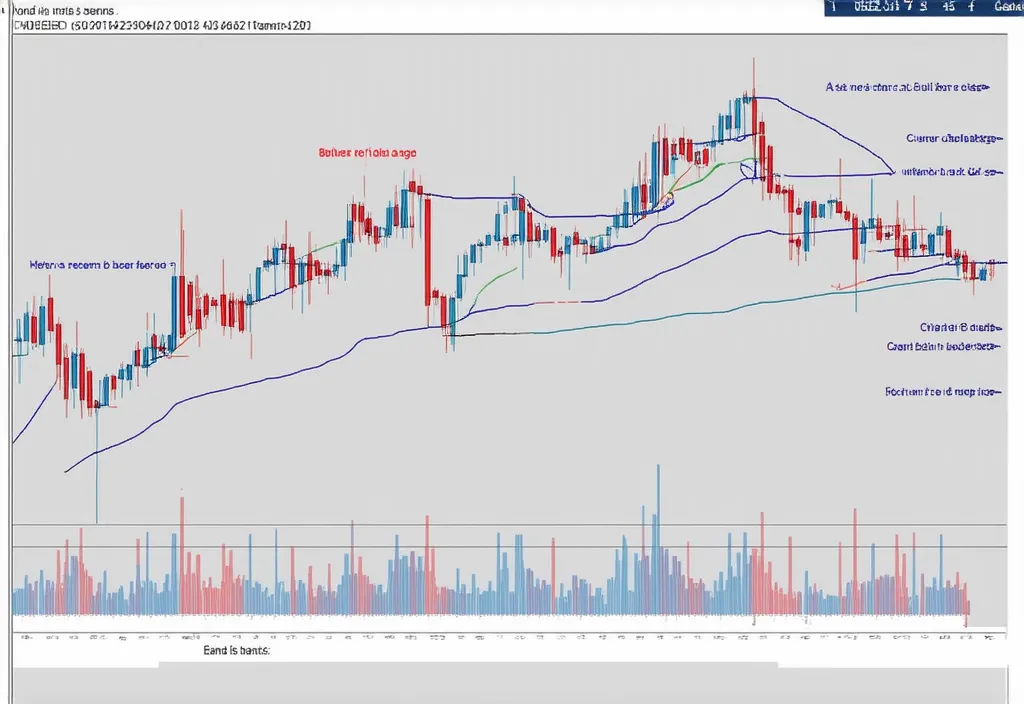
Bollinger Bands are used to measure Bitcoin’s price volatility. They consist of a simple moving average and two standard deviation bands—one above and one below the moving average. When the bands widen, volatility is high; when they contract, volatility is low.
In September 2024, Bitcoin’s Bollinger Bands showed significant expansion as market uncertainty grew, leading to rapid price fluctuations. During periods of ‘Band Squeeze,’ where the bands narrow, traders anticipate a sharp price movement.
Fibonacci Retracement: Identifying Support and Resistance Levels
Fibonacci Retracement levels are used to identify potential support and resistance zones. Common retracement levels are 23.6%, 38.2%, 50%, and 61.8%. Traders apply these percentages to price movements to anticipate reversal levels.
In October 2024, Bitcoin retraced to the 61.8% level after a rally, which many traders viewed as a strong support zone. The price bounced back from this level, signaling a continuation of the upward trend.
"Fibonacci retracements are invaluable for setting buy and sell targets, allowing traders to capitalize on potential reversals with confidence."
Additional Indicators: MACD, Stochastic Oscillator, and Volume Analysis
Apart from MAs, RSI, Bollinger Bands, and Fibonacci, traders often utilize indicators such as the Moving Average Convergence Divergence (MACD), Stochastic Oscillator, and volume analysis to confirm trends and momentum. These additional indicators enhance prediction accuracy, especially when multiple signals align.
For instance, in a period where Bitcoin’s price and volume are rising, accompanied by an upward MACD crossover, traders interpret these signals as a sign of bullish strength.
- Moving Average Convergence Divergence (MACD): Used to identify potential buy or sell signals when the MACD line crosses the signal line.
- Stochastic Oscillator: Useful for identifying overbought and oversold conditions similar to RSI.
- Volume Analysis: Higher trading volumes during price increases suggest strength in the trend.
Conclusion: Leveraging Technical Indicators for Bitcoin Trading Success
Technical analysis plays a critical role in the Bitcoin market, where sentiment and speculation drive rapid price changes. By mastering indicators like Moving Averages, RSI, Bollinger Bands, and Fibonacci Retracements, traders gain a strategic advantage. These tools provide insights into trend direction, momentum, and support-resistance levels, helping investors make informed decisions in a volatile market.
While no indicator guarantees certainty in prediction, using a combination of tools increases the reliability of signals. For Bitcoin investors, developing a comprehensive understanding of these indicators can improve timing for entry and exit, maximize gains, and mitigate losses in a dynamic and competitive market.
Quest Lab Writer Team
This article was made live by Quest Lab Team of writers and expertise in field of searching and exploring
rich technological content on Cryptocurrency and its future with its impact on the modern world